

Collaboration 2.0 — R&D Operating Model
Redesigning how a 100-person R&D division decides things
Differentiator track · a diagnosis and design record · Level 1–2 (skeleton)
Version 1.0 — the foundational version of this entry.
Background Story
Two-minute read. If you read nothing else, read this.
Background Context
It is a story of a digital-industries division of roughly 100 technical staff — industrial condition-monitoring products, IIoT, embedded and platform software. The division started in 2016 with about 20 experts and scientists. Given the high hopes — or maybe the apparent necessity — of keeping up with the trends of the so-called digital revolution, this R&D unit got support, expanded its projects and studies, and ended up with about 100 people working there by 2024. Its customers were mostly other parts of the same industrial group, plus some external plant operators.
Then in 2026, with the national economy under severe pressure, the authorities suddenly zoomed in on the division and questioned whether the programme had succeeded. And here is the interesting part. There was an ongoing debate, with a wide spread of opinion, on the answer to “was it a failure?” As the wise might expect, a definite answer to that question is not the important side of the argument. Nevertheless, if you take the financial return to date as the central criterion, it is hard to answer anything other than “Yes”.
In the middle of that sudden curiosity from the higher decision makers, and their strong will to prune the system (rather like Elon Musk swinging a chainsaw over his head), the engineers and developers were the main focus of the blame. It was no big surprise that they were the ones most likely to be pruned first. Then I brought up an argument — which I believe almost nobody could defeat — showing that the problem is not the employees. It is rooted somewhere else, around the very hand holding the chainsaw.
That is why I believe that if you miss the nuances of managing projects like this, the final bill is bigger than the wasted time and money — you end up paying in culture. And once a bad culture settles in, uprooting it is far harder than getting the management right in the first place.
What did I do?
Diagnosis
I have known the organization since I was a member of the APAC Research Group during my M.Sc. The research group worked with them from time to time, so I was always aware of their internal processes and projects. My observations always set me thinking about how the concepts and ideas I study in complex systems and socio-cultural systems could explain the repeated patterns and the systematic malfunctioning of this one.
The visible symptoms were the ordinary ones, which you have probably witnessed yourself from time to time: slipped schedules, duplicated work, friction at integration points, products that reached the market without anyone able to say who the customer was. The diagnosis was that these were not independent problems. They were being driven by an underlying mechanism.
More detail at 1.1 · Symptoms and diagnosis
Intervention
At some point I got the chance to put my ideas to the division’s leaders, and we found that we could build a dialogue and a shared understanding effectively. That encouraged me to take a couple of steps further, write a structured analysis, and propose a solution named Collaboration 2.0. It is deliberately not a culture program. It is a change to the authoring process of a single document — the Product Requirement Document — chosen on the reasoning that an organization can be made to adopt a document, but cannot be made to adopt trust. The PRD was the wedge; transparency, distributed decision-making, and traceable credit were smuggled in as properties of its workflow rather than declared as values.
This work grew into a phased 24-month strategy, a concrete process design, document templates, and a role and responsibility model mapped to ISO/IEC/IEEE 15288.
The framework I proposed comes out of my system-oriented thinking, and especially my bias toward framing any problem with people in it as a complex system — a socio-cultural system. One common example of how a minor change at the micro level ends up as a huge change in the macro pattern is a fish swarm: adjust one behavioral variable in each fish slightly, such as the tendency to turn toward the center of the population, and the dynamics and the shape of the circling swarm change.
Collaboration 2.0 is designed on a similar mindset. It means to change the bigger patterns with changes that are:
- small,
- frequent,
- widely spread,
- and placed so that they block the causal relations in the graph discussed earlier.
Collaboration 2.0 is centered on transparency, deliberation, and the availability of contribution. The immediate outputs of those features are visibility, trackability, and therefore responsibility — and, alongside them, the harvesting of the company’s intellectual assets, which has always been the factor I weighted most heavily in the analysis.
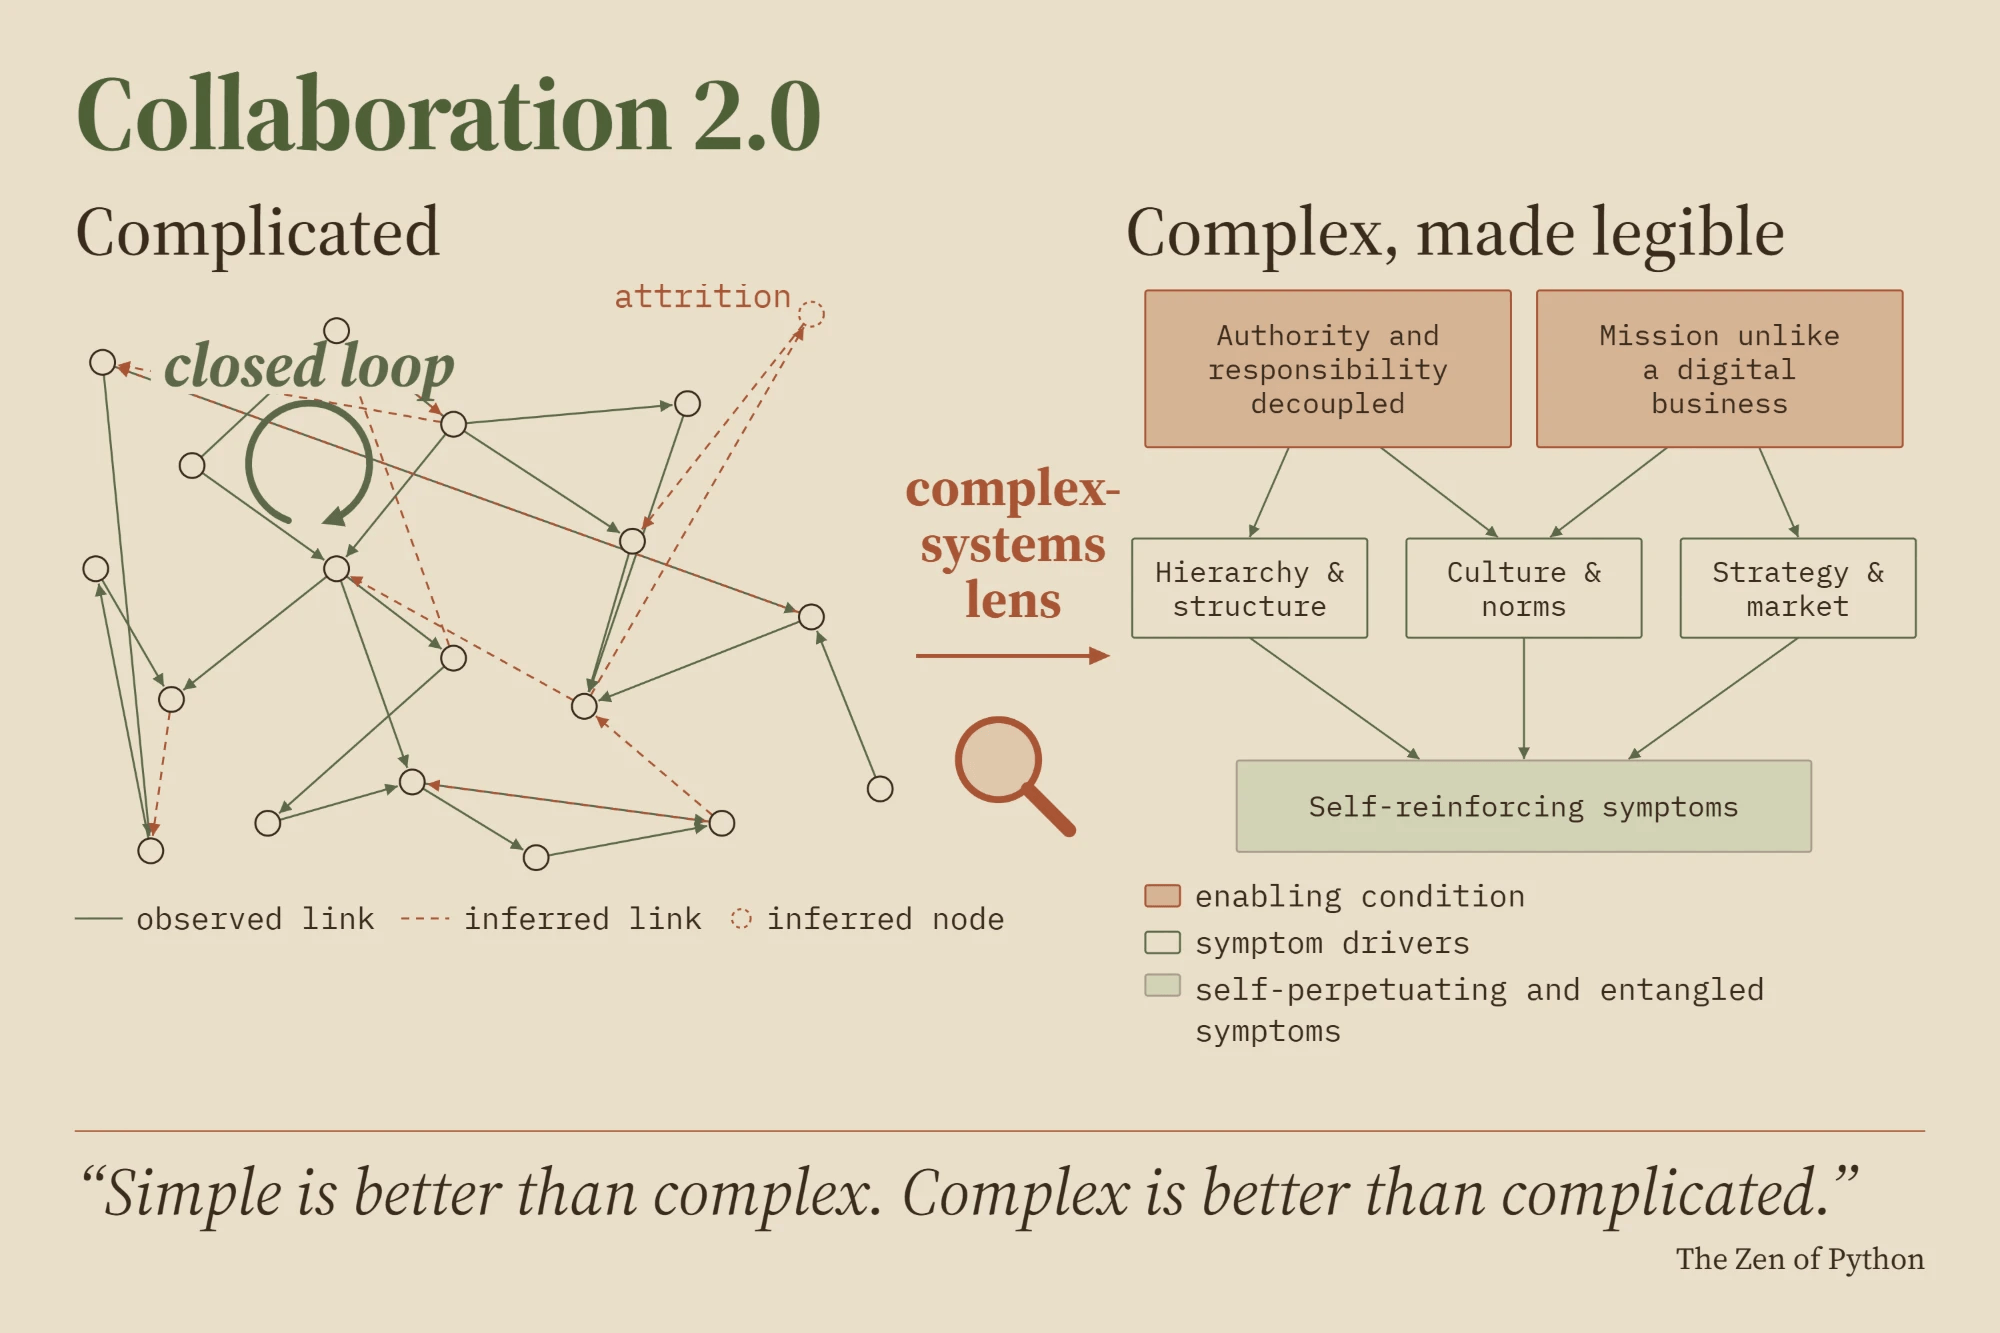
You may read all my portfolio docs and wonder: didn’t Hossein make this too complex? Then I would refer you to the Zen of Python:
simple is better than complex complex is better than complicated
Track: differentiator / socio-technical. The reasoning is the deliverable; there is no running system to demonstrate.
Figure 1 · My diagnosis and design process
Figure 1 — the diagnosis and design process. The route from the opening question to Collaboration 2.0: eliminate the capability explanation, build the symptom graph, find it will not terminate, cluster it to make it thinkable, look for roots and find that attacking them is not available — and then change the question, and design an intervention from the complex-systems side instead. Each box below names where that step is worked out. | In Figure 1 | Worked out in | | --- | --- | | I proved the problem is not intellectual assets | 1.1.2 · 4.1 | | Brainstorming: symptoms with their causes and effects | 1.1.3 | | A graph with closed circuits | 1.1.4, Figure 2 | | Distilling the graph by clustering | 1.1.5, Figure 3 | | Finding the initiators of the symptom circuits | 1.2, Figure 4 | | Why attacking the root causes is not the solution | 1.2.2 | | Complex systems — theories and inspirations | 2.1.1 · 2.1.2 | | An intervention designed from that perspective | 2.1.3 · 2.2 |
In the HTML build, the boxes in Figure 1 are clickable and go to the same places.
Contents
| Page | What it answers | |
|---|---|---|
| 1 · Modeling and diagnosis | ||
| 1.1 | Symptoms and diagnosis | How a complaint list became a circuit |
| 1.2 | Clues — where the regress terminates | What is underneath the circuit, and why it cannot be removed |
| 1.3 | Disclaimers | Where the reasoning is intuition, not proof |
| 2 · Solution — Collaboration 2.0 | ||
| 2.1 | A new lens — the organization as a complex system | Why this lens, and what it bought |
| 2.1.3 | From a model to a point of intervention | How theory became a design rule |
| 2.2 | The approach — Collaboration 2.0 | The shape of the solution |
| 2.2.1 | The blueprint | Online · transparent · shared |
| 2.2.2 | What the framework produces | Always · Everyone · Trackable |
| 2.3 | What gets discussed — the PRD | Why a document, of all things |
| 2.3.1 | Why a document, and why this one | The wedge |
| 2.3.2 | An artifact, not the culture | The decision, and what it cost |
| 2.4 | The collaborative authoring process | How it actually runs, and who owns what |
| 2.5 | The adoption argument | Why anyone would agree to this |
| 2.6 | Measurement, feedback and refinement | How you would know it worked |
| 2.7 | What would have come next | Where the design was heading |
| 3 · Ending | ||
| 3.1 | Status, outcome and reflection | What happened, where it stopped, and what it cost |
| 3.2 | Artifacts | What exists, what can be shown, and what is not claimed |
| 4 · Appendix | ||
| 4.1 | Evidence — the intellectual-assets analysis | How do you know the capability was there? |
| 4.2 | The phased strategy | What the 24 months looked like |
| 4.3 | The survey — instrument, results and reading | What the division said, question by question |
| — | What is deliberately absent | Reserved for the professional version |
Figures
| Figure | Where | |
|---|---|---|
| 1 | The diagnosis and design process | this page |
| 2 | The symptom graph, before any grouping | 1.1.4 |
| 3 | The same graph, clustered | 1.1.5 |
| 4 | The two enabling conditions | 1.2 |
| 5 | The three layers of the organization | 2.1.2 |
| 6 | The collaborative authoring loop | 2.4.1 |
| 7 | The proposed 24-month strategy | 4.2 |
| 8 | One printed survey sheet, redacted | 4.3 |