

← Portfolio · ← Collaboration 2.0
4.3 · The survey — instrument, results and reading
A tokenised, anonymous survey of a ~100-person R&D division, run in late 2025. It records how information, documentation and decisions moved through the division at the time, and how a proposed framework was received. Why the instrument was built this way is set out immediately below. The KPIs it was taken against are 2.6.1. This page carries its own local numbering, 0 to 7, which is the numbering of the original analysis.
The order in which this happened. The diagnosis in section 1, the graphs, and the design of Collaboration 2.0 all predate this survey. They came out of observation over several years, not out of these answers. The survey was designed afterwards, as the baseline measurement, and a large part of what it returned matches what the diagnosis had already claimed. That is support for the diagnosis, not the source of it.
The instrument. The full questionnaire — all twenty items, both parts, with the transcription notes — is rendered at survey-instrument.html. Every question below is quoted from it and can be checked against it.
Provenance. The rendered instrument is the English transcription of the Persian original fielded on Porsline.
The instrument — how it was made anonymous
The problem. The intervention needed a before-and-after measurement, taken from people whose main complaint was that speaking honestly could cost you your career. Any instrument that could be traced back to a respondent would measure the political weather instead of the thing it was pointed at.
The decision. A survey handed out as individually printed sheets. Each sheet carries a token that works once, and a QR code to the survey. You type in the token to get in.
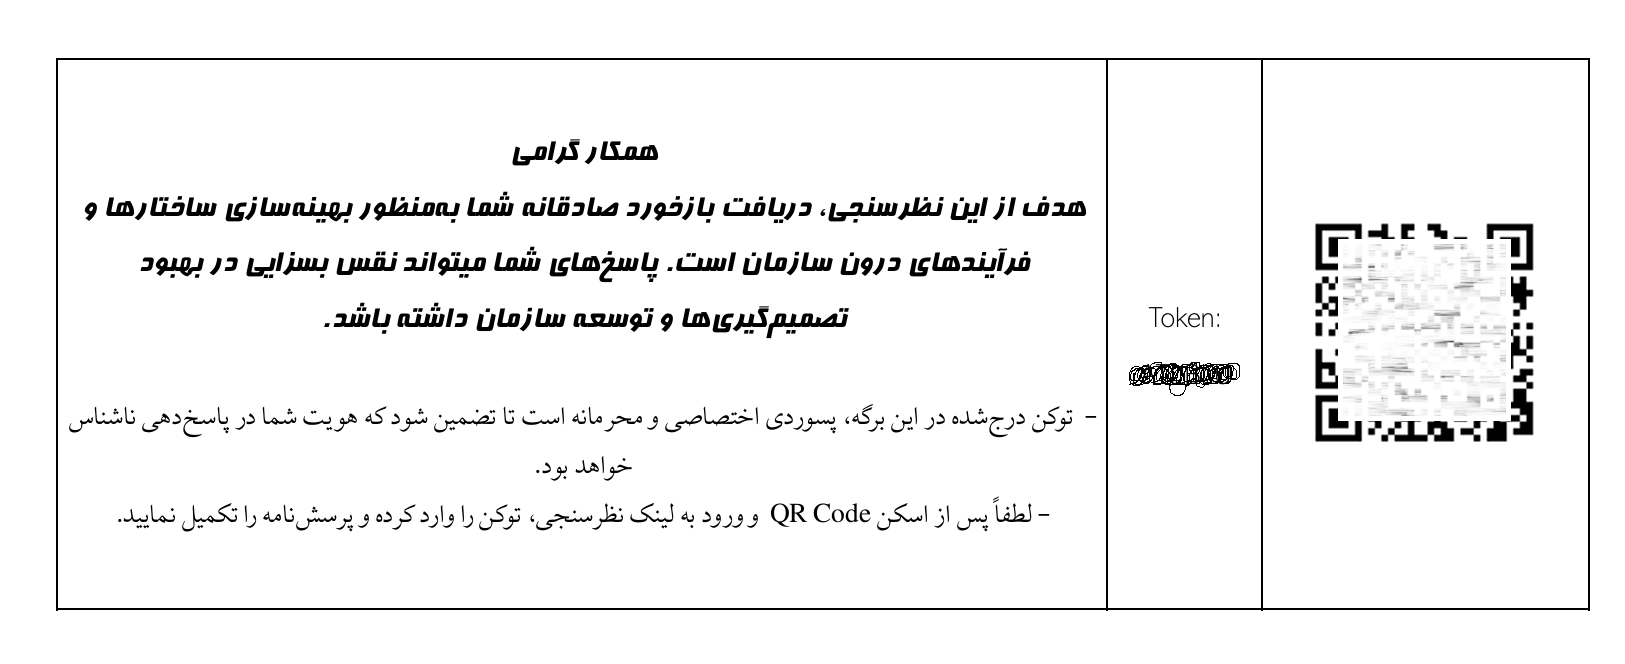
Figure 8 — one of the printed sheets, with the token and the QR code blanked. The text tells the respondent what the token is for before it asks them to use it.
What the design buys. It separates two things you normally have to trade against each other:
- Response integrity — one answer per person, nobody voting twice, and you know how many people you asked. Normally this needs to know who they are.
- Anonymity — normally this means giving up knowing how many people you asked.
A token handed out on paper, at random, never written down against a name, gives you both.
The sheet says so to the respondent, in its first line: the token is there to guarantee that your identity stays anonymous. Telling the respondent exactly what they are protected from is part of how it works, not a courtesy. Nobody trusts an instrument whose trustworthiness is left unexplained.
The alternatives not taken.
- Named surveys. You measure the atmosphere, not the organization.
- An open anonymous link. You lose the denominator, you cannot stop repeat submissions, and you cannot claim any coverage.
- Interviews. Higher fidelity, but the interviewer is a line to management by construction. Here that is not a bias you correct for. It is the main thing you would be measuring.
- Feedback collected by managers. You are asking the mechanism under investigation to report on itself.
What it cost. Distributing paper. No way to chase the people who did not answer. No way to break the answers down by team or seniority without making people identifiable again. And no way to match one person’s baseline answer to their follow-up answer, which rules out paired analysis and leaves a weaker comparison between groups.
The instrument itself did something worth noting.
Most of it asked about how things worked then. How information gets passed around. How long it takes to get a clarification. How often work gets written down, and what stops it. Whether people know where their responsibility ends. Whether they think they have ideas worth saying, and whether they think saying them is safe.
Then it asked three questions directly:
- What flaws do you see in the design of Collaboration 2.0?
- How might Collaboration 2.0 obstruct or harm you?
- What obstacles do you expect in making it real, and what would you propose?
Asking people to attack your own proposal, anonymously, before you deploy it, is the same move as the mandatory disclaimer section in 2.3.1. It is also the only way available to find out whether people are reading the reform as surveillance, which was the main risk to adoption (2.5).
0 · How to read these numbers
- The response set is small. Each respondent moves any percentage by a large step, so the percentages below look more precise than they are. Question 16 received one response fewer than the other items, so its percentages rest on a slightly smaller base.
- No comparison group, no breakdown. The instrument deliberately collects no team or seniority data, so nothing here can be tested for significance and no subgroup can be compared against another. What the results support is a reading, not a measurement.
- Part 1 is a baseline; Part 2 is not. Questions 2 to 13 ask people to describe routines they lived inside every day. Questions 14 to 17 ask them to assess a framework they had encountered once, in a short explanatory video.
- The timing of Part 2 matters more than its content. The survey went out at almost the same moment that the systems design team concluded that the organizational changes then underway had removed any realistic prospect of launching Collaboration 2.0. That conclusion was widely known. The division had also spent a long period absorbing a succession of new plans, frameworks and tools, and had little appetite for another. Several respondents said in conversation afterwards that they had not watched the explanatory video at all. Part 2 therefore measures how far the proposal travelled, not what people thought of it.
- Question 1 is the single-use token and carries no data. Question 2 was fielded but is not included in the results export used here; see section 6.
1 · The current situation
1.1 People still try to be heard, and they do not expect it to change the decision
Q3 — Confidence That Ideas Will Be Heard and Reviewed
Question: If you put forward an idea, how confident are you that it will actually be heard and reviewed?
Scale: 1–5
1: Not confident
5: Very confident
Three in ten answered above the midpoint, two in ten answered below it, and half sat exactly on it. This was the opposite of the expected result, which was a clear negative skew.
The reading is that people near the base of the organization do continue to put their views to the nearest tier of leads and supervisors. Nobody is telling them directly to stop speaking. The channel to the immediate superior is open.
Question 4 then appears to contradict this.
Q4 — Obstacles to Participating in Decisions
Question: What are your obstacles to participating in decisions?
Multi-select: Select any number of options.
| # | Option | Participants |
|---|---|---|
| 1 | Concern about non-expert criticism | 20% |
| 2 | Concern about biased or ill-intentioned criticism | 20% |
| 3 | Bureaucratic and hierarchical structure | 50% |
| 4 | A sense that decisions have already been made | 50% |
| 5 | No mechanism or opportunity to express ideas | 20% |
| 6 | I see no obstacle to participating in decisions | 0% |
| 7 | No opinion | 10% |
| 8 | Other | 0% |
Half named the bureaucratic and hierarchical structure as an obstacle to participating in decisions, and half named the sense that decisions have already been made higher up. Two in ten said there was no mechanism for expressing an idea at all. Not one respondent selected I see no obstacle.
The two answers only look contradictory. Put together they describe a single pattern: the willingness to contribute is intact, and the contribution does not reach the point where the decision is taken. What is suppressed is not the attempt but its effect.
That pattern has a direct cost in a research and development division. The people at the base of such a division are its most prolific source of ideas, and their expertise sits closest to the current state of the field. An organization of this kind depends on those people having a route by which their thinking can surface. Where the route is missing, willingness decays into low motivation, and low motivation shows up in the quality of the work.
1.2 Documents are not live objects
Q5 — Documentation Frequency
Question: How often do you document your work processes or decisions?
Single choice
| # | Option | Participants |
|---|---|---|
| 1 | Daily | 10% |
| 2 | Weekly | 10% |
| 3 | Monthly | 30% |
| 4 | Only at the end of projects | 40% |
| 5 | Never | 10% |
| 6 | Don’t know / no information | 0% |
Seven in ten document either monthly or only at the end of a project. One respondent documents never. Only two in ten document daily or weekly.
A document written at the end of a project cannot be used to coordinate that project. The answers describe records that are produced after the work they describe is finished, and that are therefore never referred to while decisions are still open. Under those conditions documentation has no function in the development process itself. It is done to discharge an obligation rather than to inform anybody.
1.3 The hierarchy, not the tooling, is what withholds information
Q6 — Challenges in Obtaining Necessary Information
Question: What is your most significant challenge in obtaining necessary information from other teams or individuals?
Multi-select: Select any number of options.
| # | Option | Participants |
|---|---|---|
| 1 | Delay in response | 40% |
| 2 | Information is incomplete | 0% |
| 3 | Not knowing who the information should be obtained from | 30% |
| 4 | Information received is outdated | 10% |
| 5 | Complexity of hierarchical requirements | 70% |
| 6 | Don’t know / no information | 0% |
| 7 | Other | 0% |
Seven in ten named the complexity of hierarchical requirements. This is the highest count recorded anywhere in the survey.
Software development depends on the routine parts of a process being fast and largely automatic. A requirement that a request for information travel up one chain and down another is not compatible with that. The size of this count indicates how much of the division’s effective capacity the structure was absorbing.
Three in ten also said they do not know who holds the information they need. That is a separate failure from delay, and it points at the same place as the clarity questions: where responsibilities are not explicit, the map of who knows what does not exist either.
This is the structure → culture route from 1.1.5, described by the people standing on it.
Question 9 gives the consequence in elapsed time.
Q9 — Time to Receive a Complete and Correct Answer
Question: In teamwork, if the information you have received is incomplete, then despite your follow-up, how long on average does it take for the complete and correct answer to reach you?
Single choice
| # | Option | Participants |
|---|---|---|
| 1 | A few hours | 0% |
| 2 | 1–2 days | 20% |
| 3 | About a week | 40% |
| 4 | A few weeks to a month | 20% |
| 5 | I almost never receive a precise answer | 20% |
| 6 | Don’t know / no information | 0% |
Four in ten said about a week, two in ten said a few weeks to a month, and two in ten said they almost never receive a precise answer at all. That last group is small, and it is the most informative one in the item. It shows that the disorder is not uniformly mild — in some parts of the division a request can simply fail, and the person making it has no recourse.
1.4 The channels in use confirm the same constraint
Q7 — Channels for Exchanging Work Documents and Agreements
Question: At present, through which channels do you mostly exchange work documents and agreements with colleagues?
Multi-select: Select any number of options.
| # | Option | Participants |
|---|---|---|
| 1 | Corporate email | 70% |
| 2 | Non-corporate email | 0% |
| 3 | Shared drives (shared folders / SharePoint) duplicate — see note 2 | 30% |
| 4 | Corporate messengers (e.g. Mattermost or Discord) | 20% |
| 5 | Non-corporate messengers (Telegram or WhatsApp) | 0% |
| 6 | Verbal and informal conversation | 50% |
| 7 | Shared drives duplicate — see note 2 | 30% |
| 8 | Don’t know / no information | 0% |
| 9 | Other | 0% |
Seven in ten named corporate email. Email is a slow medium by construction, and its dominance here is a further sign of how far formal requirements were dictating the shape of everyday technical exchange.
Five in ten named verbal and informal conversation. Open verbal exchange is valuable and worth encouraging in general terms; that is not in dispute. The caution applies specifically where the boundaries of responsibility and decision ownership are unclear, which questions 4 and 13 both indicate they were. In that setting, anything with the character of an agreement is likely to become contested later. Such items need to be written down somewhere that can be referred back to, even minimally.
No respondent named a wiki.
1.5 What stops people writing things down — and what does not
Q10 — Factors Preventing Documentation
Question: Which factors most prevent you from documenting?
Multi-select: Select any number of options.
| # | Option | Participants |
|---|---|---|
| 1 | Lack of time and high workload | 40% |
| 2 | Concern that the documents will later be used against me (being criticised) | 0% |
| 3 | A sense of futility (nobody reads these documents) | 20% |
| 4 | Current documentation tools are hard to use | 0% |
| 5 | No suitable documentation tool exists | 10% |
| 6 | Not being in the habit of recording knowledge | 20% |
| 7 | Managers do not ask for it or place value on it | 40% |
| 8 | No opinion | 0% |
| 9 | Other | 0% |
Two options were each named by four in ten: lack of time and workload, and managers not asking for the work or placing any value on it.
The second is the more actionable of the two, and the two are connected. Where a lead never asks for a record and never uses one, producing it is a pure addition to the working day with no return. The behaviour is a rational response to the incentive in front of the person.
The first practical conclusion of the whole survey follows from this. Collaboration 2.0 cannot be introduced past the team leads; it has to be introduced through them. Persuading that layer is a precondition, not a rollout detail.
Two options were named by nobody at all. Not one respondent said current documentation tools are hard to use, and not one said they fear their documents will later be used against them.
The second of those deserves attention, because question 4 recorded a related concern. Between two and four respondents named criticism — either uninformed or ill-intentioned — as an obstacle to participating in decisions. So concern about being judged unfairly exists when the setting is a discussion, and it disappears when the setting is a written record.
The explanation offered elsewhere in this entry accounts for that difference. Consider the conditions under which a knowledgeable person becomes reluctant to state what they know. It happens when the exchange takes place verbally, in a meeting with few people present, and when the positions taken in it may affect how resources are allocated afterwards. In that setting, pressing an argument has little chance of changing the outcome, and a real chance of being read as personal friction.
A written and openly visible exchange changes those conditions. More people with relevant expertise are in a position to follow the argument, which is the sense in which they act as judges — they need only be aware of it, not adjudicate it. Those readers can tell a well-supported claim from a thin one, because a written claim can be checked against the references it rests on. An unrecorded discussion offers no such check, and it is most advantageous to whoever benefits from the absence of a record.
The zero on question 10 is consistent with this account. People did not report fearing the written form, because the written and public form is the part of the proposal that protects them.
2 · The reception of Collaboration 2.0
2.1 The proposal did not reach its audience
Q14 — The Philosophy of “Collaboration 2.0”
Question: The philosophy of “Collaboration 2.0”:
Scale: 1–5
1: I did not understand it
5: I understood it completely
Q16 — Goals of Collaboration 2.0
Question: In your view, if Collaboration 2.0 were implemented, which of the following goals would be achieved?
Single choice
| # | Option | Participants |
|---|---|---|
| 1 | Making use of the intellectual and knowledge capital of people at all levels of the organization | 11% |
| 2 | Creating motivation and room for individual growth | 0% |
| 3 | Clarifying the responsibilities of individuals and teams | 11% |
| 4 | Creating transparency and improving access to information | 0% |
| 5 | Improving coordination and interaction between teams | 0% |
| 6 | Alignment and integration of the product portfolio | 0% |
| 7 | Clarifying the business direction, objectives and project prioritisation | 0% |
| 8 | Reducing unnecessary meetings | 0% |
| 9 | No opinion | 78% |
| 10 | Other | 0% |
Note: Q16 received one response fewer than the other items, so its percentages rest on a slightly smaller base.
Four in ten answered 1 to question 14 — did not understand it. Eight in ten answered 3 or below. Most of those who answered question 16 selected no opinion. Question 17, below, records the same absence: four in ten had no view on what concerned them about the system.
Read against the timing described in section 0, these three items are consistent with a single explanation. The material was not engaged with, because by the time it arrived the audience had reason to believe nothing would come of it. This is a finding about the rollout. It says nothing either way about whether the framework was sound.
2.2 The concern people did name is workload
Q17 — Concerns About the New System
Question: What is your biggest concern about this new system?
Multi-select: Select any number of options.
| # | Option | Participants |
|---|---|---|
| 1 | Complexity of the software and difficulty working with it | 10% |
| 2 | One more task added to daily duties (workload overhead) | 30% |
| 3 | Non-participation | 20% |
| 4 | Excessive managerial monitoring of activities | 10% |
| 5 | No opinion | 40% |
| 6 | Other | 0% |
Among respondents who named a concern, the most frequent was that the system would add one more task to the working day. Three in ten named it. One respondent named excessive managerial monitoring, and one named software complexity.
This lines up exactly with question 10, where workload was one of the two leading barriers to documenting anything. The objection that actually came back is about cost in time, and it needs a different answer from the one prepared for it.
2.3 Wiki tools are unfamiliar, and that is not a local problem
Q15 — Familiarity with Wiki Tools
Question: How familiar are you with wiki tools (such as Confluence)?
Scale: 1–5
1: Very little
5: Very much
Seven in ten answered 1 or 2, and five in ten answered 1.
This is unsurprising rather than discouraging. Knowledge management is a field whose importance is being recognised more widely each year, and tools of this class are only now becoming common. The implication is that the low familiarity found here is unlikely to be specific to one division of one company. If the reasoning behind Collaboration 2.0 holds, its application is not confined to the organization it was designed for.
3 · What the written answers add
Questions 18 and 19 asked for a sentence and for criticism, in free text. Five people answered the first, three the second. Both are open fields in the instrument and produced no chart. The full translations and the detailed mapping are held with the source material; the four findings worth carrying are these.
The complaint is aimed at the decision, not at the right to speak. Two respondents asked for less interference from managers and for fewer personal pronouncements by them. Neither asked for permission to be heard. This is the question 3 and question 4 pattern in the respondents’ own words: the willingness is intact, and it is overridden where the decision is made.
Somebody asked to be measured. One respondent set out, at length, what they wanted made visible for every project — who is executing each part, what was planned against what was delivered, cost against benefit — and closed by asking that performance be assessed by people other than those who did the work. That is a request for third-party evaluation on a written record, volunteered in an open field. It is stronger evidence than the zero on question 10 that people did not read the proposal as surveillance, because it is a presence rather than an absence.
People wanted the outcome without having a view on the proposal. Most had no opinion on what Collaboration 2.0 would achieve. Yet in free text, respondents named transparency, documentation and cooperation as the problems they most wanted solved — the framework’s own goals. The no opinion answers therefore record a failure of reach, not indifference to the aim.
One respondent named the rollout defect. Asked for criticism of the framework, they replied that the implementing team should explain it and take feedback from all colleagues in face-to-face meetings. That is a request for the conversation the twenty-minute video replaced, made by someone on the receiving end of it.
size of it.
One respondent rejected the premise. Translated from the Persian:
The company’s main problem is not documentation at all. The problem is that nobody knows which way the company is going. We are in a transitional state, and it does not look as though a clear direction will be set any time soon. Reassignments, tasks changing hands, and no clear future — that is the main obstacle to the company holding together. Documentation ranks below it.
That objection lands on the strategy-and-market cluster, which is exactly where 2.3.2 admits the wedge cannot reach. It is the strongest single criticism in the set. A second respondent was blunter: it will not be workable in an organization with this little maturity.
One thing the instrument itself got wrong. Eight in ten gave the identical score to is there room to put an idea forward and do you expect the idea to be heard, and one more was a
4 · The four KPIs at the baseline
The four KPIs, at the start.
| KPI | What the ten answers say |
|---|---|
| Accountability | Half say the boundary between their team’s responsibility and another team’s is unclear — 1 or 2 out of 5. Nobody answers 5. Half also say careful documentation would clarify responsibility and stop blame moving sideways — 4 or 5 out of 5 |
| Communication ratio | Work documents and agreements move by organizational email (7 of 10) and by informal conversation (5 of 10). Shared drives are third (4 of 10; the option appeared twice in the form). Organizational messengers, two. Nobody names a wiki, because there was not one |
| Time-efficiency | Eight in ten say that when what they are given is incomplete, and they chase it, the correct answer takes a week or more to arrive. Two in ten say they almost never get one at all. Two in ten say one to two days |
| Intellectual utilization | Room to put an idea forward averages 3.2 out of 5. Expecting the idea to actually be heard averages 3.0. Getting at the records of earlier projects averages 2.5, with half at 1 or 2 |
Two habit questions sit underneath those. Half write down their work only at the end of a project, or never. Satisfaction with how fast and how well information reaches people averages 2.7 out of 5.
The time-efficiency row is the one to keep. It is a single number about a single observable event, and it is the only question here a second round could compare against directly.
5 · What follows for the design
- The leads are the pivot. People do not document because the layer above them neither asks for records nor uses them. No platform changes that. Securing the leads is the first move of any rollout, and it is a precondition rather than a phase.
- The written, open form is the mechanism — not the tool. Nobody reported the existing tools as a barrier, and nobody reported fearing the written record. What the framework supplies is a setting in which a claim is visible to enough qualified readers to be assessed on its merits.
- Reach is a separate problem from merit. The Part 2 answers measure how far the proposal travelled inside a division that had already concluded it was not going to happen. They cannot be used to evaluate the framework, in either direction.
- The design was under-consulted, and one respondent said so. The remedy named from inside the population is the one the rollout skipped: explain it in person, and collect the objections before the design is finished rather than after.
- The willingness is present and unspent. People are still putting ideas forward into a structure that does not carry them. That is the most encouraging finding in the set, because it is the resource any intervention of this kind has to work with.
- Two of the design’s assumptions were corrected here. The design never claimed the tool was the point, and nobody named the tools as a barrier — so the weight falls on the authoring loop that makes a document required and read, not on the platform. And the adoption argument was built against the risk that people read transparency as surveillance; the instrument pointed at that risk and workload came back instead. Overhead needs a different answer from distrust.
6 · Items recorded but not read here
These four questions were fielded and answered, and the analysis above does not draw on them. They are included so the record is complete.
Q8 — Satisfaction with Information Quality and Speed of Access
Question: Overall, how satisfied are you with the quality and speed of access to information under current routines?
Scale: 1–5
1: Very dissatisfied
5: Very satisfied
Q11 — Access to Previous Project Records and Documentation
Question: How easy and transparent is your access to the records and documentation of previous projects?
Scale: 1–5
1: Very difficult
5: Very easy
Q12 — Documentation and Clarification of Responsibilities
Question: In your view, how much can accurate documentation help to clarify responsibilities and to prevent blame being shifted onto others?
Scale: 1–5
1: No effect at all
5: Very effective
Q13 — Clarity of Responsibilities and Authority Between Teams
Question: Is the boundary of responsibilities and authority between your team and other teams clear?
Scale: 1–5
1: Very unclear
5: Very clear
Questions 12 and 13 are the most substantial gap. Read together they say that respondents rate the clarity of responsibility boundaries at a mean of 2.5, and rate documentation’s ability to clarify responsibility at a mean of 3.6. That is the population identifying the problem and endorsing the proposed remedy for it, in their own answers, before hearing the proposal. It is a stronger piece of support for the argument than anything currently in section 1.
Question 2 — In the current situation, how open do you feel the space is for putting forward new ideas and participating in decisions? — was fielded and is missing from the results export used here. Its mean is recorded elsewhere as 3.2. The item is discussed in section 7 below, because it is the one the instrument itself got wrong.
7 · Caveats
Points where the numbers need care.
- The 40% figure for concern about criticism in question 4 is an upper bound. The item is multi-select, so the two respondents who named uninformed criticism may be the same two who named ill-intentioned criticism. The true count is between two and four.
- Question 4 and question 10 do not ask about the same thing. Question 4 asks what blocks participation in decisions; question 10 asks what blocks documenting. Reading the zero on one against the count on the other is a suggestive contrast, not a controlled one.
- In question 17, no opinion was the single most frequent answer at four in ten. Workload at three in ten is the most frequent named concern, which is what section 2.2 claims. The stronger reading of the item is section 2.1, not section 2.2.
- Question 3’s most common answer was the exact midpoint, chosen by half. The item supports the claim that confidence was not strongly negative. It does not support a claim that confidence was positive.
One defect in the instrument. Questions 2 and 3 were designed to come apart — the room to put an idea forward is one thing, the expectation that it will be heard is another. They did not come apart. Eight in ten gave the two items identical scores, and one more was a single point apart. Either the gap is not there, or respondents read the two as one question. The second is more likely, and the wording needs fixing before any second round.
Two defects in the form itself. Question 7 lists shared drives twice, as options 3 and 7; the counts above reproduce the form as fielded rather than merging them. Question 16 carries no explicit multi-select instruction and is rendered as single-select, inferred from the response counts summing with no overlap. Both are recorded in the transcription notes at the foot of survey-instrument.html.
Weight of the free-text answers. Eight substantive responses in total, and several of the points in section 3 rest on a single respondent. Free text records what was most salient to the person writing, not everything they would endorse. It supports the claim that somebody said this unprompted. It does not support a claim about what the population thinks.
⟵ Up: Collaboration 2.0 · Previous: 4.2 · The phased strategy